 Wallis & Futuna Demographics
Population of the Wallis and Futuna Islands (2026)
View live population, charts & trends: Population of the Wallis and Futuna Islands
年龄中位数
The median age in the Wallis and Futuna Islands is 38.6 years (2026).
Fertility in Wallis and Futuna
总和生育率(TFR)为2.1代表更替水平生育率:在不考虑国际移民的情况下,为使每一代人口能够正好替代其自身,每位女性平均需要生育的子女数量。低于2.1的数值将导致本地人口下降。
Life Expectancy in Wallis and Futuna
另请参阅:全球各国预期寿命排名
Infant Mortality Rate and Deaths of Children under 5 Years Old in the Wallis and Futuna Islands
Wallis & Futuna Urban Population
Currently, 0% of the population of the Wallis and Futuna Islands is urban (0 people in 2026)
人口密度
The 2026 population density in the Wallis and Futuna Islands is 79 people per Km2 (206 people per mi2), calculated on a total land area of 140 Km2 (54 sq. miles).
另请参阅
来源
- 世界人口展望:2024年修订版 - 联合国人口司
- 世界城市化展望 - 人口司 - 联合国
- GeoNames
- 联合国统计司
- 世界银行
- 经济合作与发展组织 (OECD)
定义
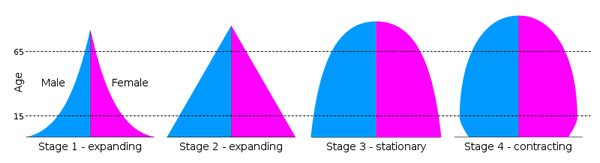
人口金字塔
人口金字塔(也称为“年龄性别金字塔”)是人口年龄和性别构成的图形化表示。
类型:
- 扩张型 - 塔基宽阔的金字塔(年轻年龄组人口比例较大,表明出生率和生育率高)和塔顶狭窄(死亡率高,预期寿命较低)。这表明人口在增长。示例:尼日利亚人口金字塔
- 收缩型 - 塔基狭窄的金字塔(年轻人口比例较低,表明出生率下降,每个后续年龄组都比前一个年龄组小)。示例:美国
- 稳定型 - 各年龄组人口比例大致相等。人口稳定,既不增长也不减少。
阶段:
抚养比
年龄抚养比有三种类型:少儿抚养比、老年抚养比和总抚养比。这三种比率通常都乘以100。
少儿抚养比
定义:0-15岁人口除以16-64岁人口。
公式:([0-15岁人口] ÷ [16-64岁人口]) × 100
老年抚养比
定义:65岁及以上人口除以16-64岁人口。
公式:([65岁及以上人口] ÷ [16-64岁人口]) × 100
总抚养比
定义:少儿抚养比与老年抚养比之和。
公式:(([0-15岁人口] + [65岁及以上人口]) ÷ [16-64岁人口]) × 100
注:抚养比未考虑各年龄组的劳动参与率。被计为“劳动年龄”的部分人口实际上可能失业或未加入劳动力大军,而被计为“受抚养”的部分人口可能已就业,不一定在经济上具有依赖性。