 Nauru Demographics
- Population
- Median Age
- Fertility Rate
- Life Expectancy
- Infant and Children under 5 Mortality
- Urbanization and Population Density
- [Sources and more info]
Population of Nauru (2026)
View live population, charts & trends: Population of Nauru
Median Age
The median age in Nauru is 20.2 years (2026).
Fertility in Nauru
A Total Fertility Rate (TFR) of 2.1 represents the Replacement-Level Fertility: the average number of children per woman needed for each generation to exactly replace itself without needing international immigration. A value below 2.1 will cause the native population to decline
Life Expectancy in Nauru
See also: Countries in the world ranked by Life Expectancy
Infant Mortality Rate and Deaths of Children under 5 Years Old in Nauru
Nauru Urban Population
Currently, 93.8% of the population of Nauru is urban (11,351 people in 2026)
Population Density
The 2026 population density in Nauru is 605 people per Km2 (1,567 people per mi2), calculated on a total land area of 20 Km2 (8 sq. miles).
See also
Sources
- World Population Prospects: The 2024 Revision - United Nations Population Division
- World Urbanization Prospects - Population Division - United Nations
- GeoNames
- United Nations Statistics Division
- World Bank
- Organisation for Economic Co-operation and Development (OECD)
Definitions
Population Pyramid
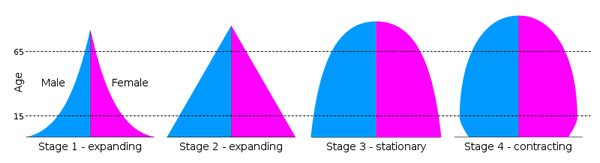
A Population pyramid (also called "Age-Sex Pyramid") is a graphical representation of the age and sex of a population.
Types:
- Expansive - pyramid with a wide base (larger percentage of people in younger age groups, indicating high birth rates and high fertility rates) and narrow top (high death rate and lower life expectancies). It suggests a growing population. Example: Nigeria Population Pyramid
- Constrictive - pyramid with a narrow base (lower percentage of younger people, indicating declining birth rates with each succeeding age group getting smaller than the previous one). Example: United States
- Stationary - with a somewhat equal proportion of the population in each age group. The population is stable, neither increasing nor decreasing.
Stages:
Dependency Ratio
There are three types of age dependency ratio: Youth, Elderly, and Total. All three ratios are commonly multiplied by 100.
Youth Dependency Ratio
Definition: population ages 0-15 divided by the population ages 16-64.
Formula: ([Population ages 0-15] ÷ [Population ages 16-64]) × 100
Elderly dependency ratio
Definition: population ages 65-plus divided by the population ages 16-64.
Formula: ([Population ages 65-plus] ÷ [Population ages 16-64]) × 100
Total dependency ratio
Definition: sum of the youth and old-age ratios.
Formula: (([Population ages 0-15] + [Population ages 65-plus]) ÷ [Population ages 16-64]) × 100
NOTE: Dependency Ratio does not take into account labor force participation rates by age group. Some portion of the population counted as "working age" may actually be unemployed or not in the labor force whereas some portion of the "dependent" population may be employed and not necessarily economically dependent.